 Eta
Eta
Docs
Eta VS Code Extension
Overview
The Eta VS Code extension bundles:
- Eta language support (
.eta) and snippets. - Language Server integration (
eta_lsp). - Debug Adapter integration (
eta_dap) with custom Eta runtime tooling. - Test Explorer integration (
eta_test, TAP format). - Disassembly document language (
eta-bytecode) with syntax highlighting.
This page is the reference for configuration, commands, debugger tooling, testing, and troubleshooting.
Installation
From an Eta release bundle
Eta release installers (install.sh, install.cmd, install.ps1) install the
VS Code extension automatically when code is on PATH.
Manual VSIX install
code --install-extension editors/vscode/eta-scheme-lang-<version>.vsix
After install, open an .eta file to activate the extension.
Quick Start
- Open an
.etafile. - Run
Eta: Debug Eta File(or pressF5). - Set breakpoints in the gutter and step with
F10/F11/Shift+F11. - Open
Eta: Show Environment InspectorandEta: Show Heap Inspector.
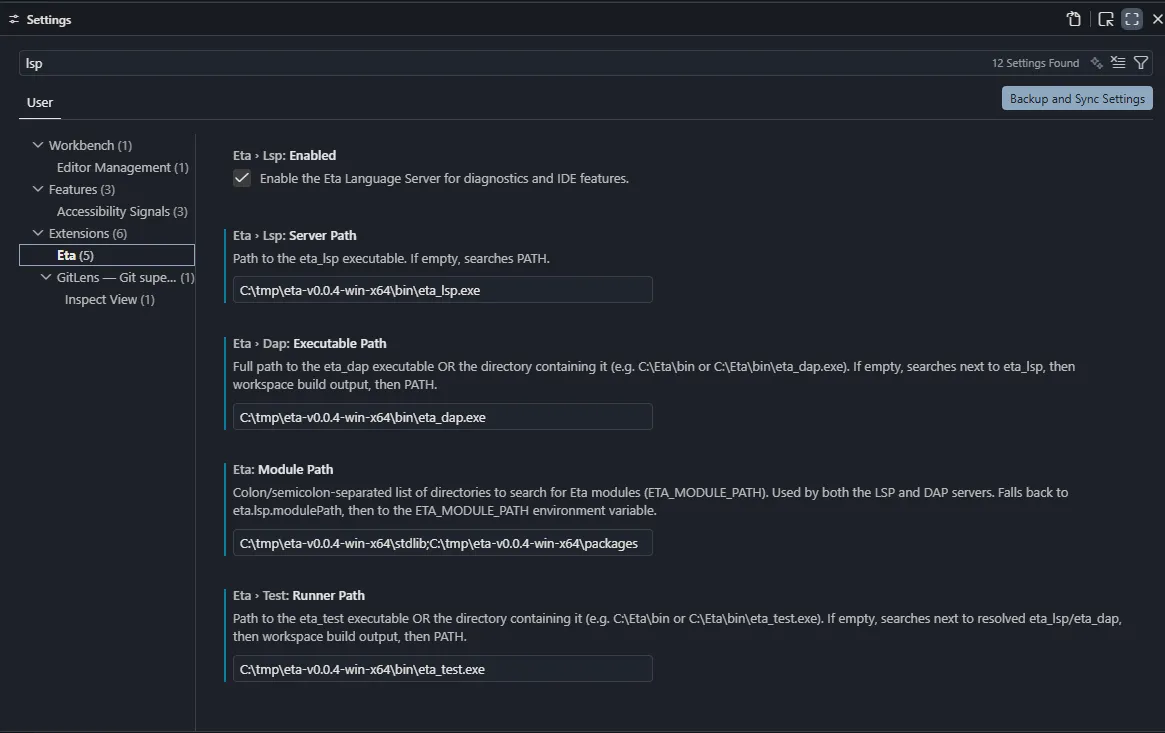
Configuration
Open Settings and search for Eta.
Core settings
| Setting | Type | Default | Notes |
|---|---|---|---|
eta.modulePath | string | "" | Module search path (ETA_MODULE_PATH) used by LSP, DAP, and test runner. |
eta.lsp.enabled | boolean | true | Enable/disable LSP startup. |
eta.lsp.serverPath | string | "" | Path to eta_lsp (file or containing directory). |
eta.dap.executablePath | string | "" | Path to eta_dap (file or containing directory). |
eta.test.runnerPath | string | "" | Path to eta_test (file or containing directory). |
eta.binaries.searchPaths | string[] | [] | Extra binary search roots or executable paths. Supports ${workspaceFolder}. |
Debug automation settings
| Setting | Type | Default | Notes |
|---|---|---|---|
eta.debug.autoShowHeap | boolean | false | Open Heap Inspector automatically (effective when heap auto-refresh is enabled). |
eta.debug.autoShowEnvironment | boolean | false | Open Environment Inspector webview on stop events. |
eta.debug.autoShowDisassembly | boolean | false | Open disassembly document on stop events. |
eta.debug.autoRefreshViewsOnStop | boolean | false | Auto-refresh debug side views (Environment/Child Processes/disassembly refresh path). |
eta.debug.autoRefreshHeapOnStop | boolean | false | Auto-refresh Heap Inspector on stops. |
eta.debug.autoRefreshDisassemblyOnStop | boolean | true | Auto-refresh current disassembly on stops. |
eta.debug.inlineValuesEnabled | boolean | false | Enable inline variable values while paused. |
Environment filter/settings
| Setting | Type | Default |
|---|---|---|
eta.debug.environment.followActiveFrame | boolean | true |
eta.debug.environment.showLocals | boolean | true |
eta.debug.environment.showClosures | boolean | true |
eta.debug.environment.showGlobals | boolean | false |
eta.debug.environment.showBuiltins | boolean | false |
eta.debug.environment.showInternal | boolean | false |
eta.debug.environment.showNil | boolean | false |
eta.debug.environment.showChangedOnly | boolean | false |
Example:
{
  "eta.modulePath": "/path/to/stdlib",
  "eta.lsp.serverPath": "/path/to/eta_lsp",
  "eta.dap.executablePath": "/path/to/eta_dap",
  "eta.test.runnerPath": "/path/to/eta_test",
  "eta.debug.environment.showBuiltins": true
}
Binary Discovery Order
The extension resolves binaries in this order.
eta_lsp
eta.lsp.serverPath<extension>/bin/eta_lsp- workspace build candidates (for example
out/msvc-release/...,out/wsl-clang-release/...) eta.binaries.searchPathsPATH
eta_dap
eta.dap.executablePath- next to resolved
eta_lsp - bundled/workspace/search-path/PATH fallback resolution
eta_test
eta.test.runnerPath- next to resolved
eta_lsp - next to resolved
eta_dap - bundled/workspace/search-path/PATH fallback resolution
Launch Configuration (launch.json)
Debugger type is eta.
| Property | Type | Default | Description |
|---|---|---|---|
program | string | ${file} | Eta source path to run/debug. |
args | string[] | [] | Program args passed through launch handling. |
cwd | string | ${workspaceFolder} | Working directory for adapter launch. |
env | object | {} | Environment variables for adapter process. |
modulePath | string | eta.modulePath | Session-level ETA_MODULE_PATH override. |
stopOnEntry | boolean | false | Pause on first instruction. |
etac | boolean | false | Run precompiled path when adapter supports it. |
console | string | debugConsole | debugConsole, integratedTerminal, externalTerminal. |
trace | boolean | false | Launch adapter with protocol tracing (--trace-protocol). |
Minimal config:
{
  "version": "0.2.0",
  "configurations": [
    {
      "type": "eta",
      "request": "launch",
      "name": "Run Eta file",
      "program": "${file}",
      "stopOnEntry": false
    }
  ]
}
Editing Features
Language and LSP
- Grammar-based syntax highlighting for Eta (
source.eta). - LSP diagnostics, completion, hover, go-to-definition, references, rename,
signature help, and symbols (when
eta_lspis available). - Code lenses:
Run FileDebug File (stop on entry)Run Tests in File/Debug Tests in Filefor*.test.eta
- Import document links: dotted module names in
(import ...)become clickable.
Snippets
The extension ships a broad snippet set including:
- core forms (
module,defun,define,lambda,let,if,cond, …) - error/macro forms (
catch,raise,define-syntax) - stdlib workflows (regex, csv, process, networking, actors, worker pool)
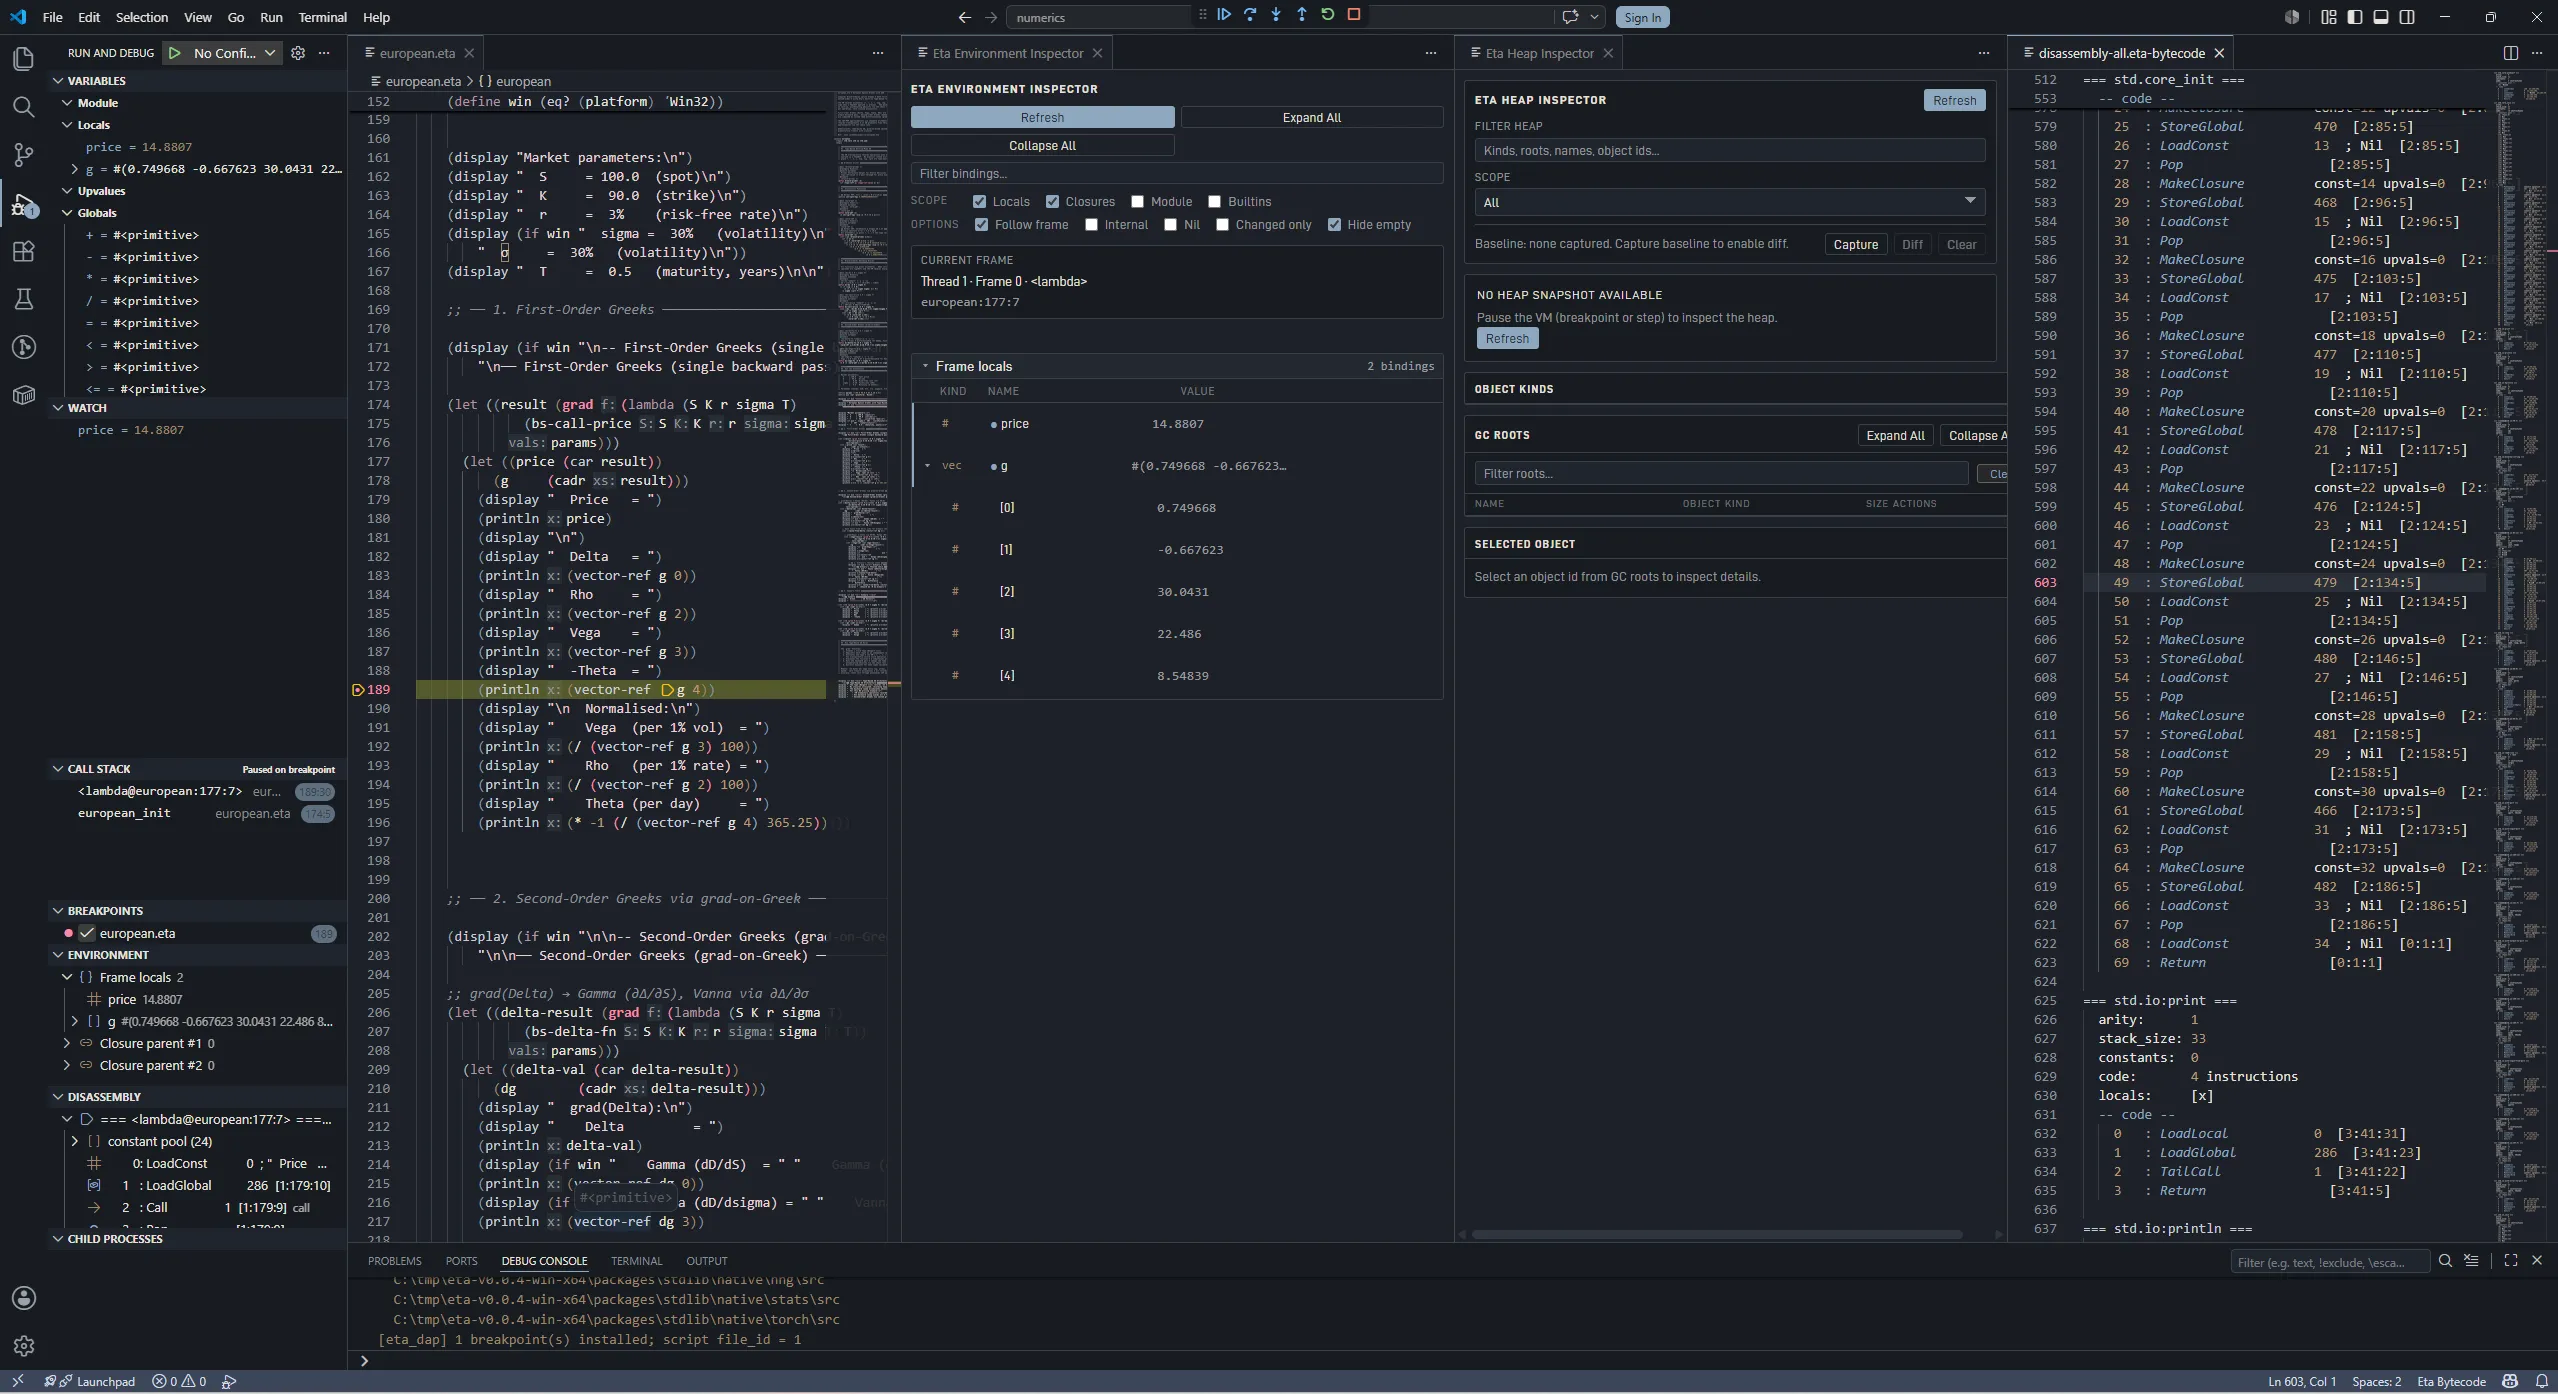
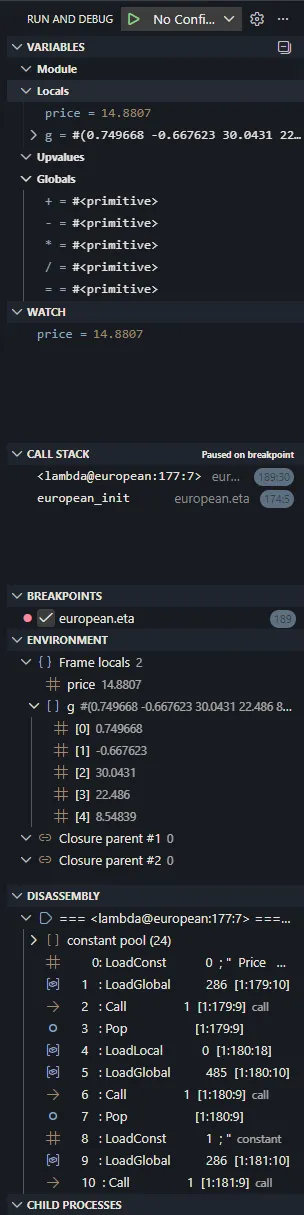
Debugging Workflow
The debug sidebar contributes:
Environmenttree viewDisassemblytree viewChild Processestree view
The extension also uses two output channels:
Eta Language(adapter/language logs)Eta Output(program stdout/stderr stream frometa-outputevents)
Environment Tooling
Eta has both a sidebar tree and a standalone inspector webview.
Environment sidebar tree (Environment)
- Shows lexical chain levels from
eta/environment:Frame localsClosure parent #NModule (...)Builtins
- Uses current call stack selection when
followActiveFrame = true. - Expands compound values through DAP
variablesrequests.
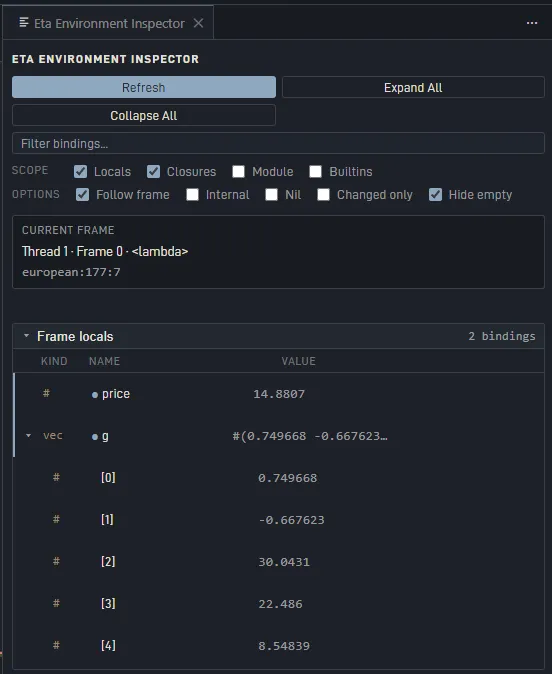
Standalone Eta Environment Inspector
Open with Eta: Show Environment Inspector.
Features:
- Refresh and Collapse All controls.
- Live filter toggles for locals/closures/module/builtins/internal/nil.
Changed Onlymode (highlights and filters bindings changed since previous stop).- Row actions:
Heap(inspect object in Heap Inspector when object id exists)Disasm(open disassembly from callable bindings)
Builtins now surfaces non-current-module runtime/global symbols, so it is no
longer limited to undotted names only.
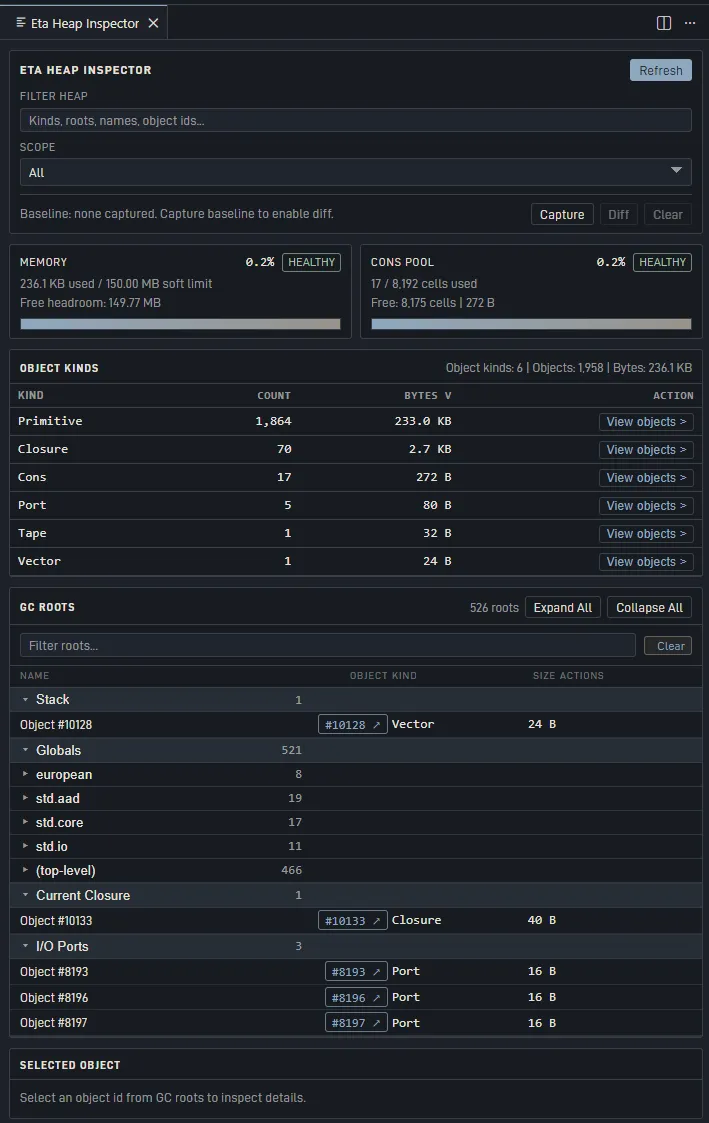
Heap Inspector
Open with Eta: Show Heap Inspector.
Features:
- Memory gauge (usage vs soft limit).
- Cons pool gauge when present.
- Object Kinds table:
- sortable columns
- filter box
- optional baseline diff mode (
Capture Baseline,Diff,Clear Baseline) - truncation indicator (
showing X of Y kinds) when capped.
- GC Roots browser with expandable groups and module grouping for globals.
- Object detail pane via
eta/inspectObject. - Retention-path search (
Find paths to root) using bounded BFS over roots.
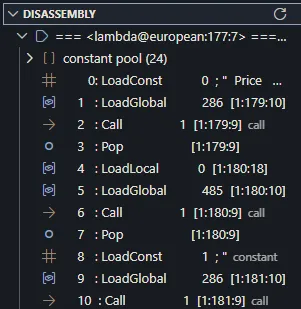
Disassembly Tooling
Sidebar Disassembly tree
- Function-grouped view with current-PC function auto-expanded.
- Constant pool section and code section.
- Opcode-aware icons/colors (calls, constants, load/store, control flow, arithmetic).
- Call/TailCall lines can jump to callee function headers.
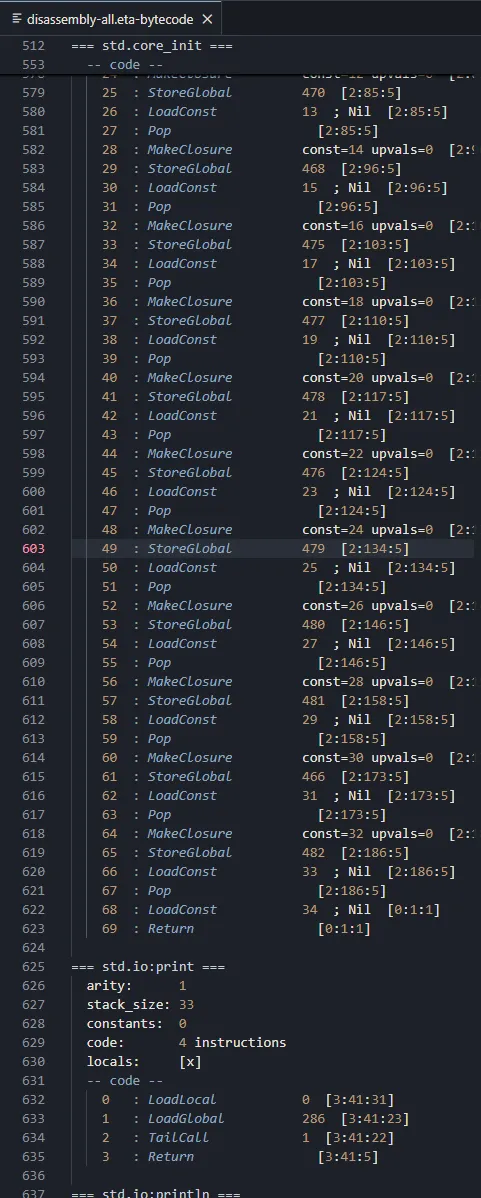
Disassembly documents
Commands:
Eta: Show Disassembly(current function context)Eta: Show Disassembly (All Functions)(full dump)
The virtual document uses eta-bytecode language (source.eta-bytecode) with
syntax highlighting for:
- function headers
- opcodes
- constants/indices/numbers
<func:N>references- strings/comments
Cross-navigation commands:
Eta: Go to Source from Disassembly(eta.disassembly.gotoSource)Eta: Show Disassembly for Source Line(eta.disassembly.revealForSourceLine)
Child Processes View
The Child Processes debug view queries eta/childProcesses and shows:
- spawned OS child processes (process id, endpoint, module path, alive/exited)
- live actor processes (actor PID, registered name, mailbox length, run state)
Use Eta: Refresh Child Processes to refresh manually.
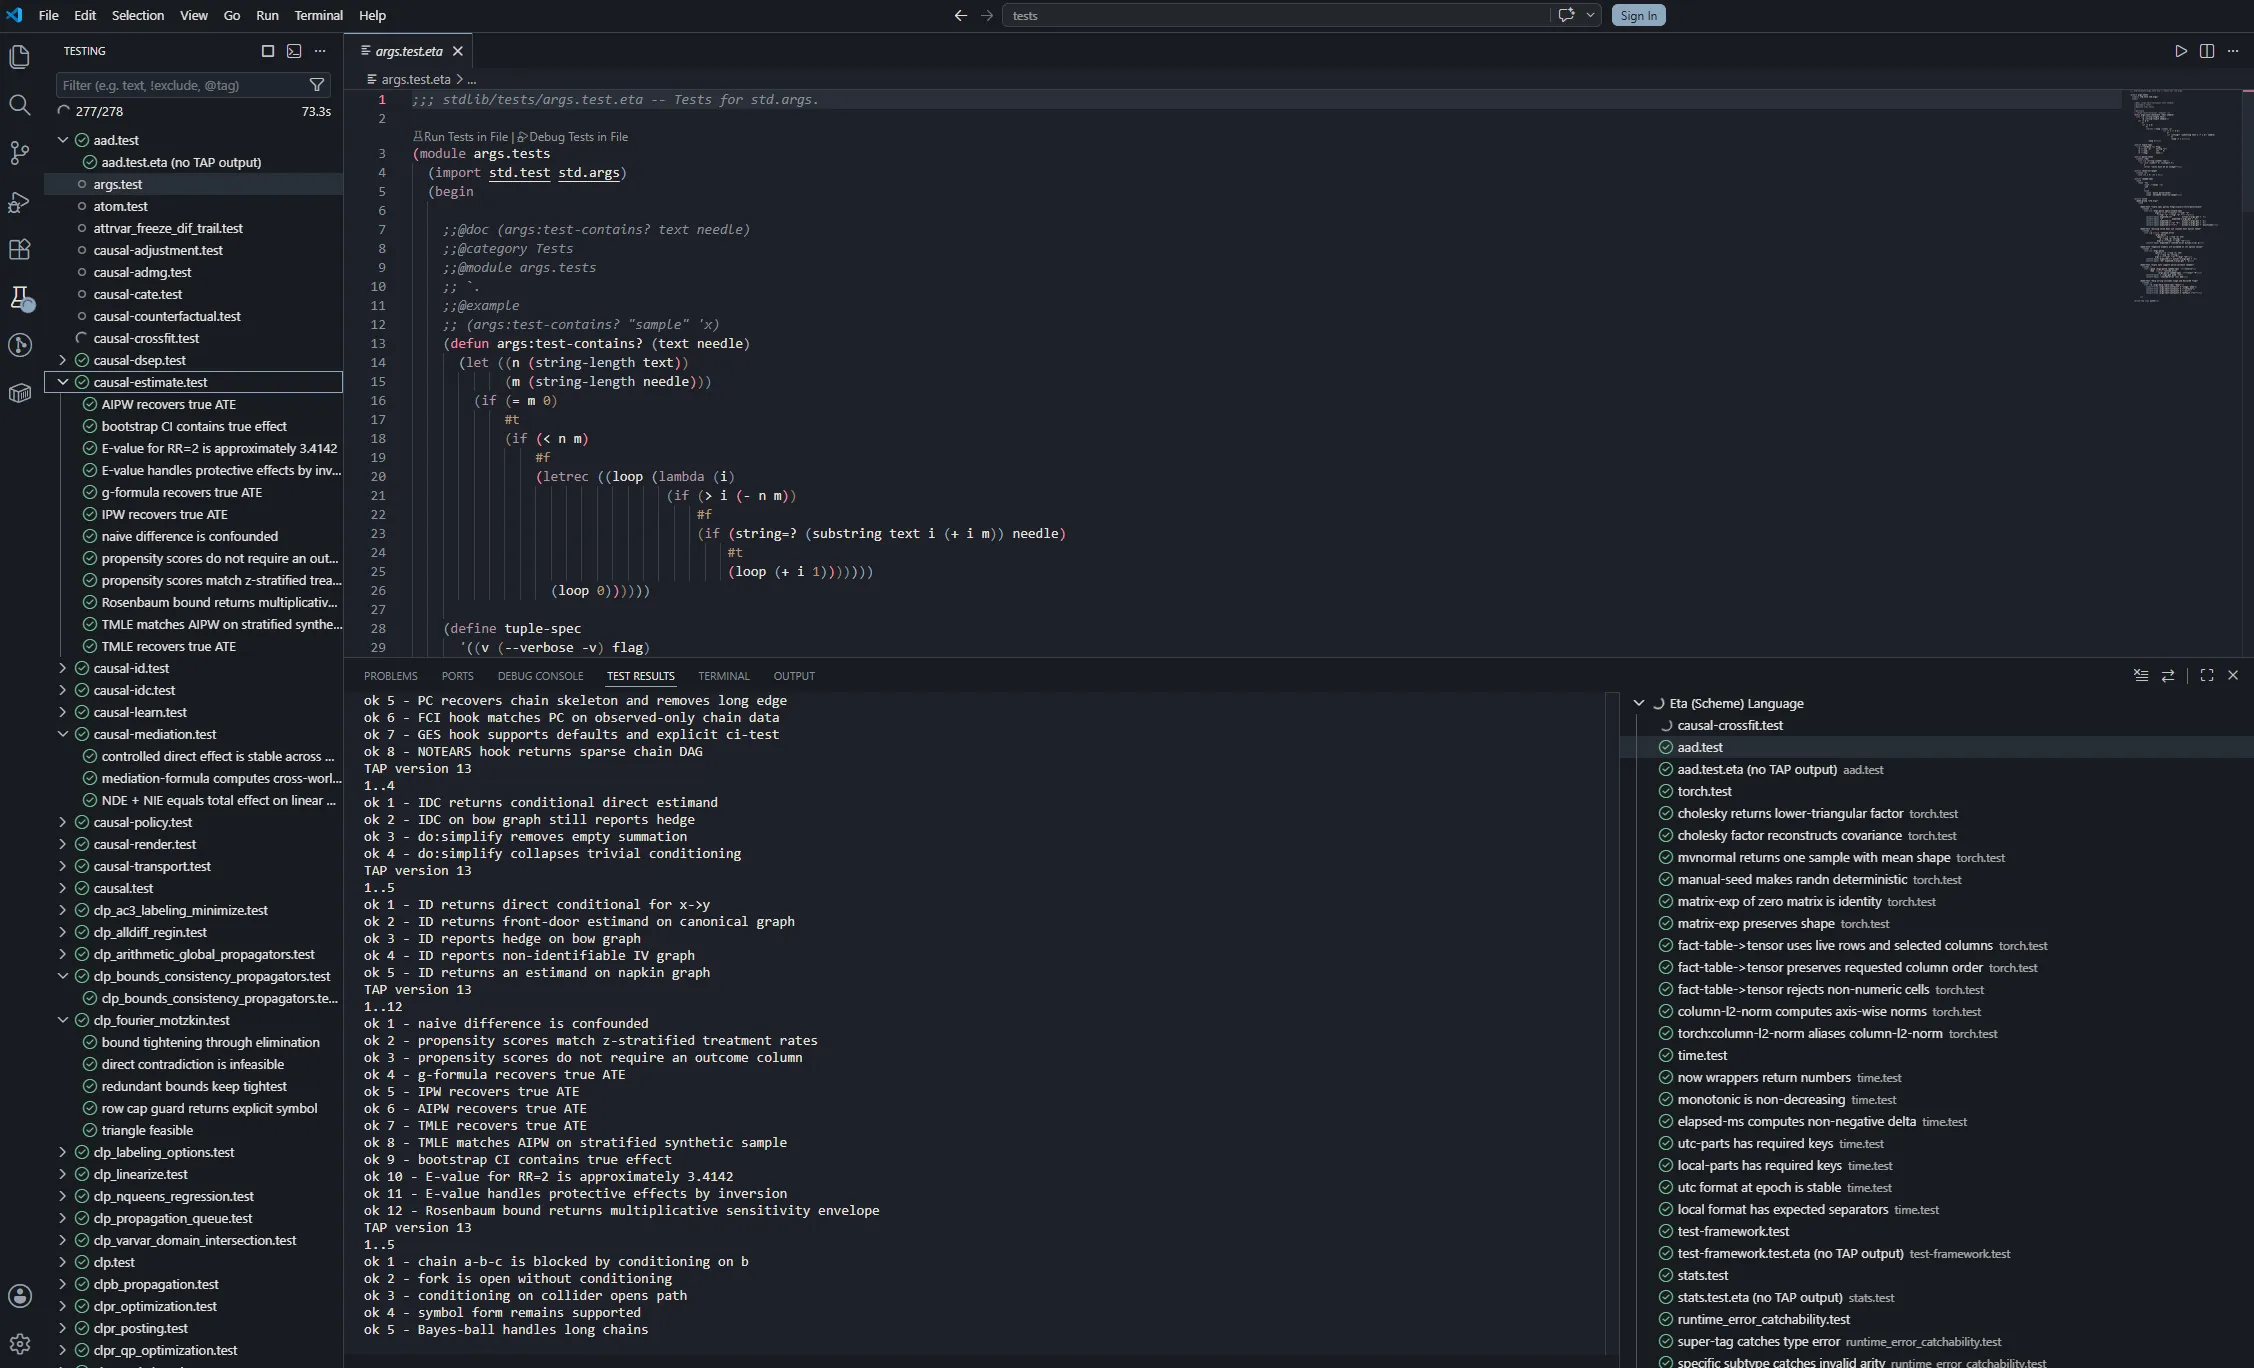
Test Explorer Integration
The extension registers a VS Code Test Controller for **/*.test.eta.
Profiles:
Run- runseta_test --format tapDebug- launches Eta debugger for the test fileCoverage- runs with--coverageand degrades gracefully if unsupported
TAP parsing is streaming, so results appear incrementally during long runs.
YAML diagnostics mapping:
| TAP YAML key | VS Code mapping |
|---|---|
message | test failure headline |
severity | detail text |
at | clickable failure location |
expected | expected output field |
actual | actual output field |
Commands
Primary commands
| Command | Description |
|---|---|
Eta: Run Eta File | Run active Eta file using the Eta debug launch flow. |
Eta: Debug Eta File | Debug active Eta file. |
Eta: Run Tests in Current File | Run tests for active *.test.eta file. |
Eta: Show Heap Inspector | Open heap webview inspector. |
Eta: Show Environment Inspector | Open environment webview inspector. |
Eta: Show Disassembly | Open current disassembly document. |
Eta: Show Disassembly (All Functions) | Open all-functions disassembly document. |
Eta: Refresh Environment | Refresh environment tree and inspector. |
Eta: Configure Environment Filters | Quick-pick editor for environment filter settings. |
Eta: Refresh Disassembly | Refresh disassembly sidebar tree. |
Eta: Refresh Child Processes | Refresh child process sidebar tree. |
Navigation/power commands
| Command id | Description |
|---|---|
eta.disassembly.gotoSource | Jump from current disassembly line to source location. |
eta.disassembly.revealForSourceLine | Reveal bytecode range for active source line. |
eta.disassembly.gotoCallee | Jump to callee header from call instruction (tree/doc integration). |
Troubleshooting
”Could not locate eta_lsp/eta_dap/eta_test”
Set explicit paths:
{
  "eta.lsp.serverPath": "/abs/path/to/eta_lsp",
  "eta.dap.executablePath": "/abs/path/to/eta_dap",
  "eta.test.runnerPath": "/abs/path/to/eta_test"
}
You can also add build output folders to eta.binaries.searchPaths.
”module not found” during debug/test
Set eta.modulePath to your stdlib/modules path. This is propagated as
ETA_MODULE_PATH to LSP, DAP, and eta_test.
Environment/Heap inspectors show idle state
These views require a paused Eta debug session. Set a breakpoint, then step or continue to a pause point before refreshing.
Coverage profile marks file skipped
Your eta_test build does not support --coverage yet. Run/Debug profiles
still work.
Disassembly source jump says no mapping
Source correlation relies on DAP disassembly location metadata for the current session and instruction range. Ensure you are paused in a normal Eta frame.
Developer Notes (Extension)
From editors/vscode:
npm ci
npm run compile-tests
npm test
npm run package
This produces eta-scheme-lang-<version>.vsix.