 Eta
Eta
Getting Started
Developer Tools
Eta ships a full developer-tools ecosystem: a VS Code extension with LSP, debugger, and heap inspector; a Jupyter kernel for interactive notebooks with rich output; and a built-in sampling profiler accessible from the CLI, REPL, and notebooks.
VS Code Extension
The Eta VS Code extension provides first-class editing support powered by
the native eta_lsp language server and eta_dap
debug adapter.
- LSP — real-time diagnostics, hover docs, go-to-definition, completion, rename, and signature help.
- Debugger (DAP) — breakpoints, stepping, call-stack inspection, and variable watch.
- Heap Inspector — live view of the GC heap with per-object detail.
- Disassembly View — per-function bytecode listing with current-PC highlighting during debug pauses.
- Test Runner — integrated
eta_testrunner with pass/fail markers in the editor gutter.
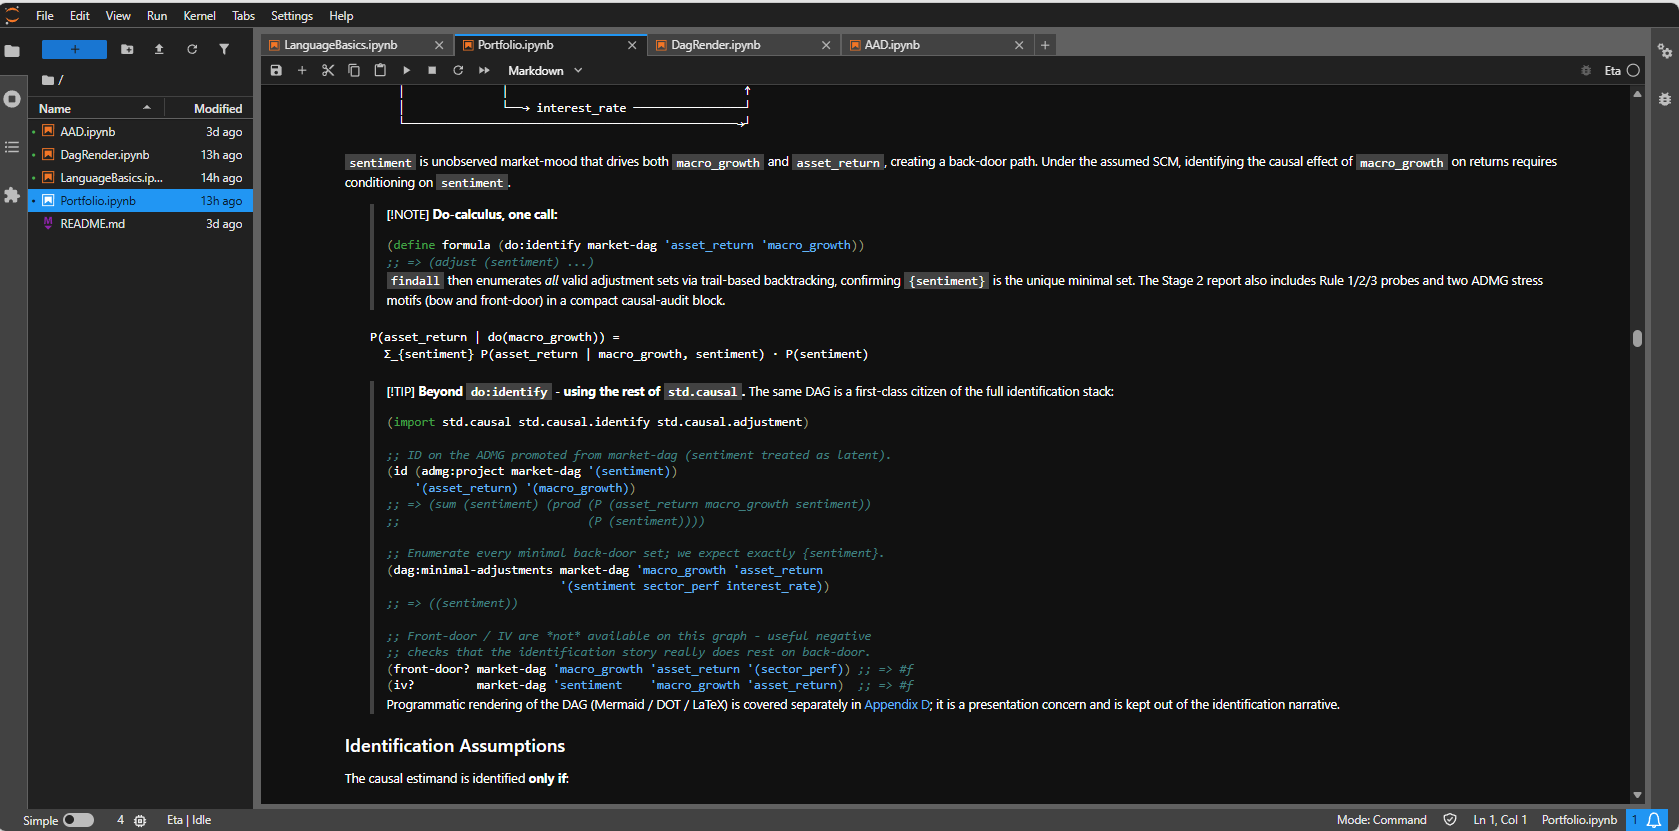
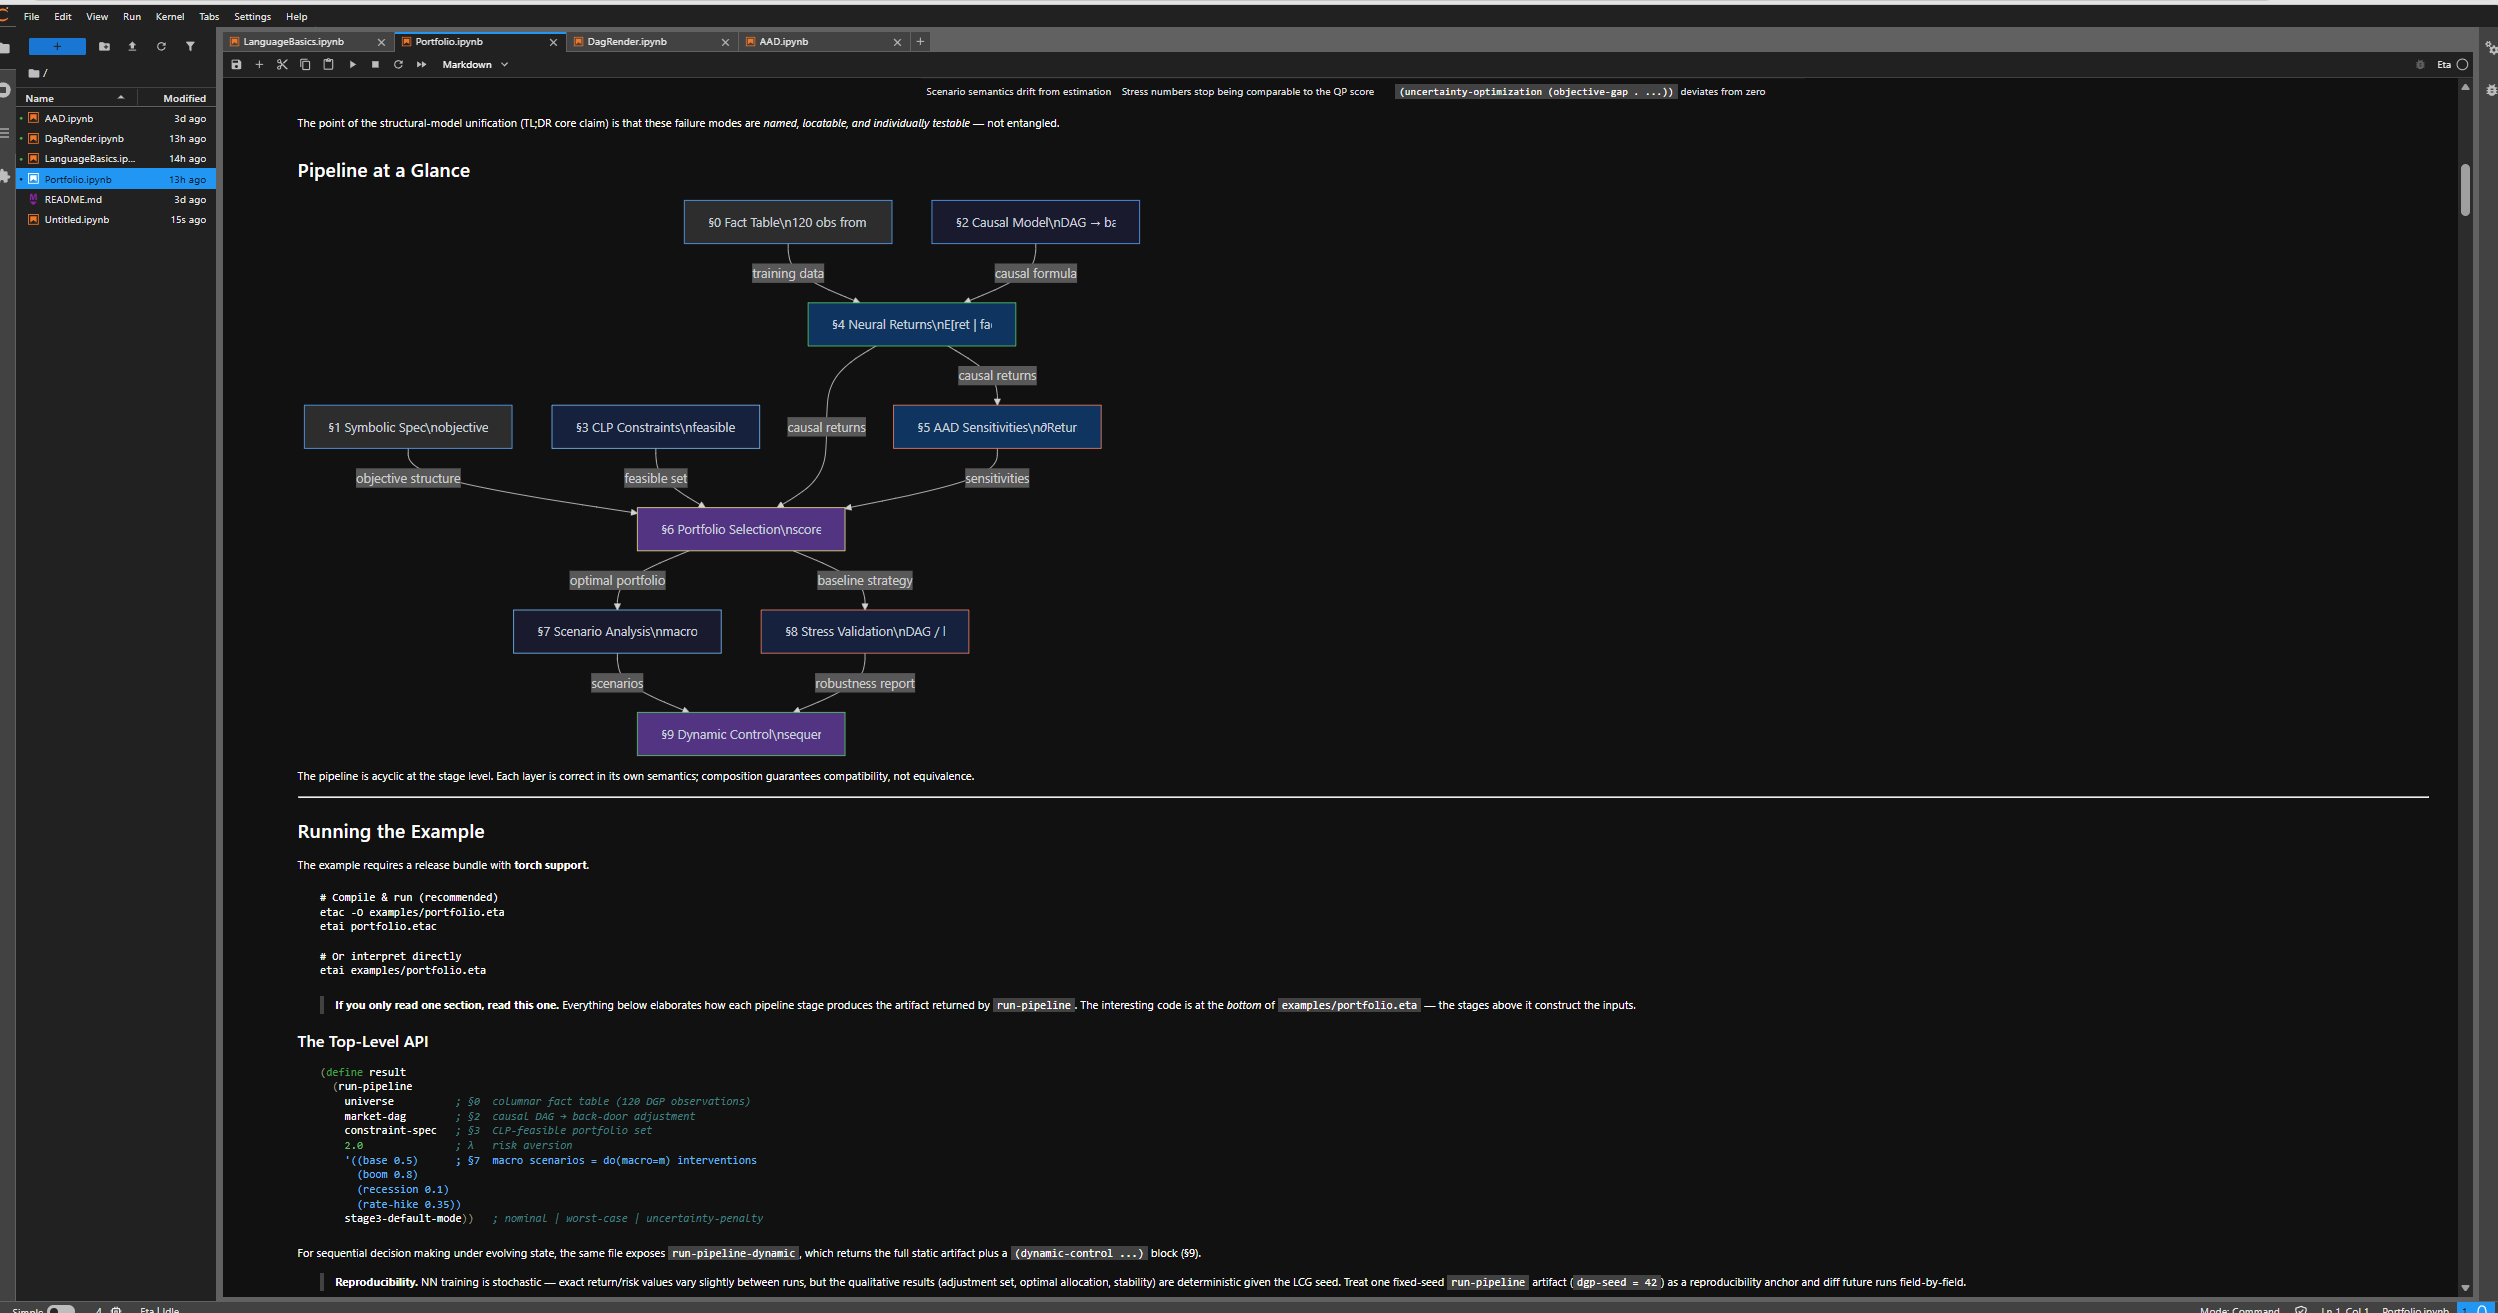
Jupyter Notebooks
eta_jupyter is a native Jupyter kernel for Eta. Install it
once and use it from JupyterLab or classic Notebook just like any other kernel.
- Rich output — tensors, fact-tables, DAGs, actor state, and Vega-Lite plots render as interactive widgets.
- Cell magics —
%time,%bytecode,%load,%%prof, and more. - Inline profiling —
%%profprofiles a single cell and renders a flamegraph inside the notebook output. - Comm widgets — live heap inspector, disassembly view, and actor-state panel without leaving the notebook.
Profiler
Eta has a built-in runtime profiler with two modes:
- Sample mode (default) — low-overhead sampled call stacks, outputs speedscope JSON for flamegraph visualisation.
- Trace mode — exact call/return accounting, higher overhead, suitable for precise attribution.
The profiler is accessible from three surfaces:
- CLI —
eta prof run,eta prof report,eta prof merge,eta prof view. - REPL — the
:profmeta-command profiles the next submission. - Notebook — the
%%profcell magic profiles one cell and renders an inline flamegraph.
# Run sampled profiling and open in speedscope
eta prof run --out profile.speedscope.json path/to/program.eta
eta prof view profile.speedscope.json

# Trace mode with pretty-print report
eta prof run --mode trace --format pretty path/to/program.eta